Historical Gold Prices: What 50 Years of Data Analysis Reveals About Your Gold Investment in 2025
Key Takeaways for Gold Investors in 2025
- Gold has delivered an impressive 7.78% average annual return since 1971
- Current gold price stands at $2,946 per troy ounce (March 2025), offering valuable investment opportunities
- Gold outperformed the S&P 500 over the last 20 years with a 579.96% return vs 402.3%
- Research supports optimal gold portfolio allocation of 17-34% for maximum risk-adjusted returns
- Historical gold price data shows March, early January, and late June offer the best gold buying opportunities
Historical Gold Price Trends Since 1970: Key Patterns Revealed
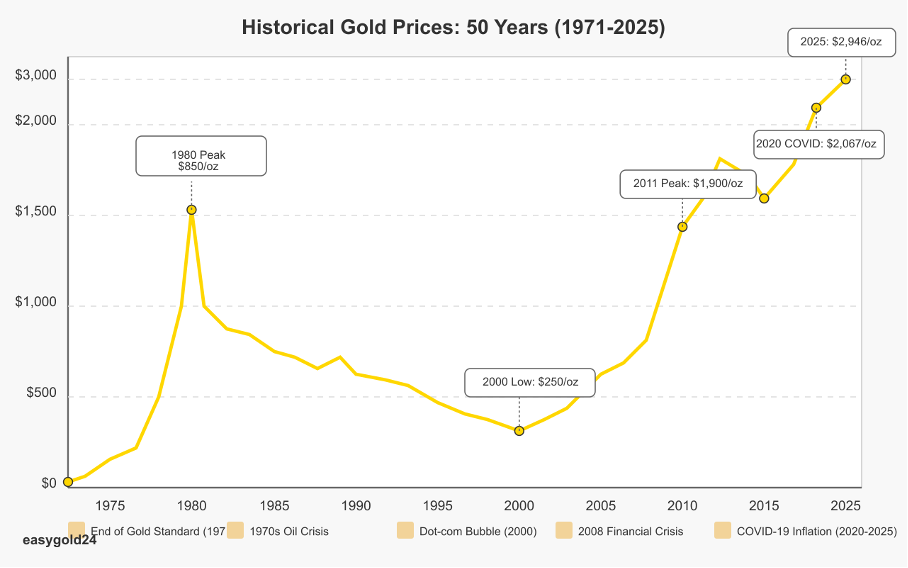
The historical gold price journey fundamentally changed after the gold standard ended in 1971, unleashing unprecedented price volatility in the precious metal’s history. Gold prices skyrocketed from $35 per ounce to $850 by January 1980, demonstrating gold’s potential for significant price appreciation during economic uncertainty.
Key Gold Price Milestones in the Historical Data
The 1970s experienced remarkable gold price increases, particularly during 1974 and 1979. The gold investment value jumped 67.04% in 1974 and achieved an impressive 133.41% gain in 1979. The gold spot price reached its first major milestone at $850 per ounce in January 1980. That amount would equal $2,800 in 2020 dollars after adjusting for inflation.
Gold prices remained relatively stable for twenty years before entering another bull market in the early 2000s. Gold investment returns steadily climbed from $250 in 2001 to over $1,900 by 2011. The COVID-19 pandemic later sparked another major rally that pushed gold prices above $2,000 per ounce by summer 2020.
As of March 2025, gold trades at approximately $2,946 per troy ounce, reflecting continued investor confidence in this precious metal during ongoing economic uncertainties.
Major Gold Market Cycles for Long-term Investors
Historical gold price data follows a distinct 16-year cycle with clear peaks and valleys. This pattern shows:
- 11-12 years of upward movement followed by 4-year corrections
- Major bottoms occurred in 1968, 1984/1985, 1999/2000, and 2016
- Each dollar invested at a cycle’s beginning typically grows to $5.20 at the peak
The first major cycle started in 1971 with declining production and rising central bank reserves. Around 2000, the second cycle began as central banks like the UK and Canada reduced their selling. The third major cycle, which started around 2016, continues today with gold price momentum remaining strong into 2025.
Notable Gold Price Crashes: What Investors Should Know
Gold has experienced several dramatic price drops throughout its history. The worst crash occurred in spring 1980 when gold investment values fell over 40% from the $850 peak. The year 2013 brought another major decline as prices dropped 30%, mostly during the second quarter.
The 2013 crash revealed unique market behavior. Two days in April accounted for almost half the year’s decline, followed by another drop to $1,180 per ounce in June. These downturns usually preceded significant recoveries. For example, after a two-year correction in the mid-1970s, gold prices surged 440% over the next three years.
Gold demonstrated its strength during market turmoil. The metal recorded its biggest one-day gain of nearly $90 per ounce during the 2008 financial crisis. During the COVID-19 pandemic, prices climbed 27% from January 2020 to summer 2020, breaking past $2,000 per ounce.
Gold vs. Other Investments: 50-Year Comparative Returns Analysis
Gold’s distinctive relationship with other investments shapes investment decision-making. Historical gold price data reveals clear correlations between gold and various asset classes.
Gold vs Stock Market: Historical Performance Comparison
Gold has provided investors a 492.8% return over the last 20 years, outperforming the S&P 500’s 402.3% gain. However, the picture changes significantly when examining a 40-year timespan. Stocks take a substantial lead with the S&P 500 reaching an impressive 3,613% return while gold trails at 611.7%.
Gold and stocks don’t typically move in tandem. Gold functions best as a portfolio stabilizer. Market experts recommend allocating 5-10% of investment funds to gold as a safe-haven asset. Unlike stocks that pay dividends or interest, gold’s returns come exclusively from price appreciation.
In 2025, with global economic uncertainties and inflation concerns, gold continues to maintain its traditional role as a hedge against stock market volatility.
Gold vs Real Estate: Which Performs Better Long-term?
The Gold-to-Housing ratio provides valuable insights into the relationship between gold and real estate prices. This ratio indicates how many ounces of gold are required to purchase an average single-family home. The ratio stood at 136 ounces in 2020, well below the average of 218 ounces since 1975.
As of early 2025, this ratio has improved further for gold investors, with approximately 130 ounces now sufficient to purchase an average US home, suggesting gold remains relatively undervalued compared to real estate in historical terms.
Real estate and gold prices typically follow different trajectories. These assets often move in opposite directions. Gold prices increased sharply after the mid-2000s housing bubble burst while housing values declined. This inverse relationship makes these assets excellent for portfolio diversification.
Gold-Currency Relationships: Impact on Investment Strategy
Gold plays a complex role in global currency markets. While modern countries no longer use it as their primary currency, it continues to influence currency values. Countries that sell gold or maintain large gold reserves typically experience stronger currencies when gold prices rise.
Gold’s relationship with the U.S. dollar deserves special attention. Research from LBMA and Trinity College Dublin demonstrates that gold moves inversely not just to the U.S. dollar, but also to several major currencies including the British pound, Japanese yen, and Canadian and Australian dollars.
For investors in 2025, understanding this inverse relationship between gold and the US dollar remains crucial, especially as global central banks continue to diversify their reserves away from dollar holdings.
What Drives Gold Price Changes: Economic Factors That Matter in 2025
Gold’s price movements in the global marketplace are influenced by factors ranging from economic indicators to investor psychology. A closer examination of these drivers reveals the fascinating patterns that explain gold’s enduring appeal.
How Do Interest Rates Affect Gold Prices?
The relationship between gold prices and interest rates represents a crucial economic driver. Gold prices tend to rise as interest rates fall, and vice versa. This correlation isn’t absolute, however—history shows other economic factors can override this traditional relationship.
In 2025, with central banks navigating complex monetary policies, investors closely monitor the Federal Reserve’s interest rate decisions for potential impacts on gold investments. The current environment of moderate interest rates continues to provide a supportive backdrop for gold prices.
Gold Price and the US Dollar Connection
Gold prices are fundamentally affected by the U.S. dollar’s strength because gold is traded internationally in dollars. Gold typically becomes more expensive when the dollar’s value decreases. Investors outside the U.S. can purchase more gold with their currency, which increases demand and prices.
The dollar’s recent fluctuations in 2025 amid global trade tensions have reinforced gold’s appeal as a hedge against currency devaluation, supporting the metal’s current price levels above $2,900 per ounce.
Central Banks and Gold Demand: Current Trends
Central banks have become influential players in gold price dynamics. These institutions now view gold as their preferred option for crisis response and diversification, according to recent surveys. This shift became evident after Russian assets were frozen, prompting other countries to increase their gold holdings.
By early 2025, central bank gold purchases have maintained their strong pace, with emerging market economies continuing to reduce dollar exposure in favor of gold reserves. This institutional demand provides a solid price foundation for the precious metal going forward.

Gold's Historical Performance During Financial Crises (1970-2025)
Gold has established itself as a dependable safe-haven asset throughout history. It performs exceptionally well during economic turmoil. An examination of major crises demonstrates gold’s remarkable ability to preserve wealth when markets experience chaos.
Gold Performance During the 1970s Oil Crisis
The 1970s oil crisis became a defining moment for gold prices. Gold demonstrated its protective power as petroleum shortages affected Western nations. Gold prices increased by 67% between 1973-1974 during the first oil shock. The Iranian Revolution triggered even more dramatic gains. Prices surged 400% from early 1979 to January 1980, reaching $843 per ounce.
Rampant inflation resulted from oil shortages, expanding social programs, and Federal Reserve monetary policies. Gold subsequently became the preferred hedge against currency devaluation. Gold-to-oil ratios reached record levels during this period and peaked at 34 in July 1973.
How Did Gold React During the 2008 Financial Crash?
The 2008 financial crisis reinforced gold’s reputation as a safe haven. Gold prices rose 2.6% in 2008 and increased 12.8% in 2009 as the Great Recession deepened. Investors turned to gold when the Federal Reserve’s quantitative easing program weakened the dollar.
Gold prices surged 50.6% between September 2010 and September 2011, ultimately reaching $1,917.90 per ounce in August 2011. This increase reflected growing concerns about economic recovery and unstable financial markets.
Gold Investment During the COVID-19 Pandemic
The COVID-19 pandemic wrote another remarkable chapter in gold’s crisis performance. Gold prices climbed 27% from January 2020 to summer 2020 and exceeded $2,000 per ounce. Gold served as a safe-haven asset during Phase I (December 31, 2019–March 16, 2020) of the pandemic.
Gold’s role evolved as the crisis unfolded. Although it briefly lost its safe-haven status during Phase II (March 17−April 24, 2020), investors subsequently increased their gold holdings as a ‘flight-to-safety’ asset. The pandemic’s economic uncertainty and unprecedented monetary stimulus increased optimal gold weightings in major stock market portfolios.
Gold in the 2023-2025 Inflationary Period
In the most recent economic cycle (2023-2025), gold has once again proven its value during inflationary pressures. As consumer prices rose across major economies, gold maintained its purchasing power, climbing from approximately $1,800 in early 2023 to nearly $3,000 by early 2025.
This recent performance reinforces gold’s historical role as an inflation hedge and demonstrates why investors continue to allocate portions of their portfolios to this precious metal during uncertain economic times.
How to Read Gold Price Charts: Technical Analysis for Investors
Technical analysis reveals crucial insights about gold’s price movements through specific patterns and indicators. Investors can make more informed decisions about their gold investments by analyzing historical data.
Understanding Key Gold Chart Patterns
The Cup and Handle pattern stands out as a reliable predictor of gold price surges. This formation displays a rounded bottom (cup) followed by a minor pullback (handle). Gold prices exhibit a 15-year Cup and Handle pattern, and prices remain near record highs.
Two other important patterns require attention:
- Double Tops: Prices reach a resistance level twice but fail to break above it. This pattern often indicates a potential bearish reversal.
- Double Bottoms: Prices create two consecutive troughs at similar levels, suggesting a possible bullish reversal.
The Head and Shoulders pattern has three peaks with the central peak being highest. This pattern typically signals a trend reversal from bullish to bearish. Traders initiate short positions after prices break below the pattern’s neckline.
Essential Technical Indicators for Gold Investors
The Relative Strength Index (RSI) is a vital momentum indicator. RSI readings above 70 suggest gold might be overbought, while readings below 30 indicate oversold conditions. Gold’s RSI stands at 53.656 as of February 2025, suggesting neutral market conditions.
Moving averages help traders identify trend strength and direction. Gold’s 50-day moving average sits at 2953.25, while the 200-day average reaches 2937.26. The ascending channel pattern shows consistent higher highs and higher lows that confirm the bullish trend.
As of March 2025, gold’s technical indicators suggest continued strength with modest upside potential, as prices consolidate near historic highs with relatively balanced momentum metrics.
Best Gold Investment Options for 2025
For investors looking to add gold to their portfolios in 2025, several options exist, each with distinct advantages:
Physical Gold: Coins, Bars, and Bullion
Physical gold ownership continues to appeal to investors seeking tangible assets. Gold coins like American Eagles, Canadian Maple Leafs, and South African Krugerrands offer convenient ownership with easy liquidity. Gold bars provide lower premiums for larger investments but require secure storage solutions.
- Premium over spot price (typically 5-10% for coins, 1-5% for bars)
- Authentication and purity verification
- Secure storage options (home safes, bank safety deposit boxes, or third-party vaults)
- Insurance costs for larger holdings
Top Gold ETFs to Consider in 2025
- SPDR Gold MiniShares (GLDM) – Lower entry point with 0.10% expense ratio
- iShares Gold Trust (IAU) – 0.25% expense ratio with high liquidity
- SPDR Gold Shares (GLD) – The largest gold ETF with high trading volume
- Aberdeen Physical Gold Shares (SGOL) – 0.17% expense ratio with Swiss storage
These investment vehicles track gold prices closely while eliminating storage and insurance concerns, making them ideal for investors seeking simple gold exposure.
Gold Mining Stocks and Royalty Companies
For investors seeking potential leverage to gold prices, mining stocks offer interesting opportunities. Top performers in early 2025 include:
- Royal Gold (RGLD) – A streaming/royalty company with diverse global assets
- Newmont Corporation (NEM) – The world’s largest gold producer
- Franco-Nevada (FNV) – A gold-focused royalty and streaming company
- Barrick Gold (GOLD) – Major producer with low-cost operations
Mining stocks typically offer dividends and potential operational leverage to gold prices, but come with company-specific risks not present in physical gold or ETFs.
Investment Lessons from 50 Years of Gold Price History
Modern investors can glean valuable insights from decades of gold price data to optimize their precious metal investments. Recent surveys indicate that 75% of wealth managers maintain minimal gold exposure, and none allocate more than 10% of their portfolios to gold.
What is the Optimal Gold Allocation in a Portfolio?
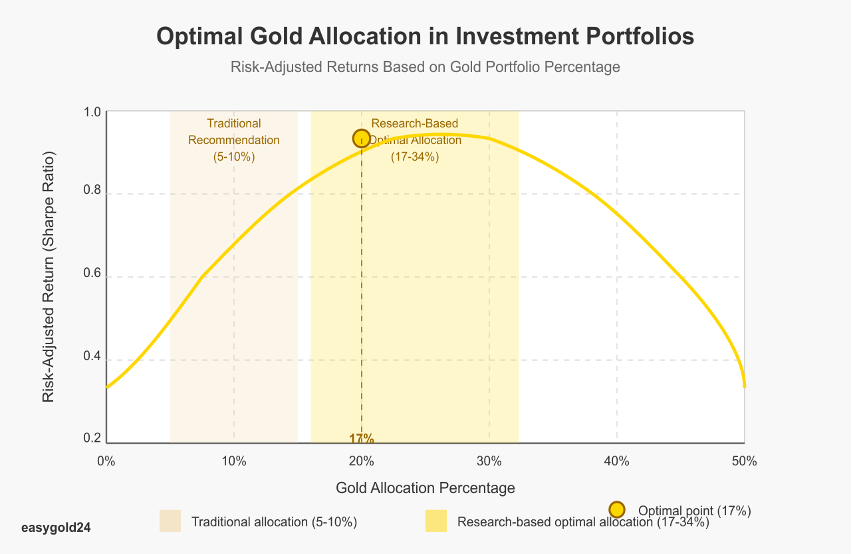
Traditional financial advisors recommend a 5-10% gold allocation for diversification. However, recent research challenges this conventional wisdom:
- Studies suggest optimal allocations between 17-34% for maximum risk-adjusted returns
- A portfolio with 17% gold and 83% balanced assets has historically delivered superior risk-adjusted performance
- During periods of high inflation or market stress, gold allocations toward the higher end of this range have proven beneficial
These findings align with gold’s proven protective qualities during market turbulence and suggest many investors may be significantly under-allocated to this asset class.
When is the Best Time to Buy Gold? Historical Patterns
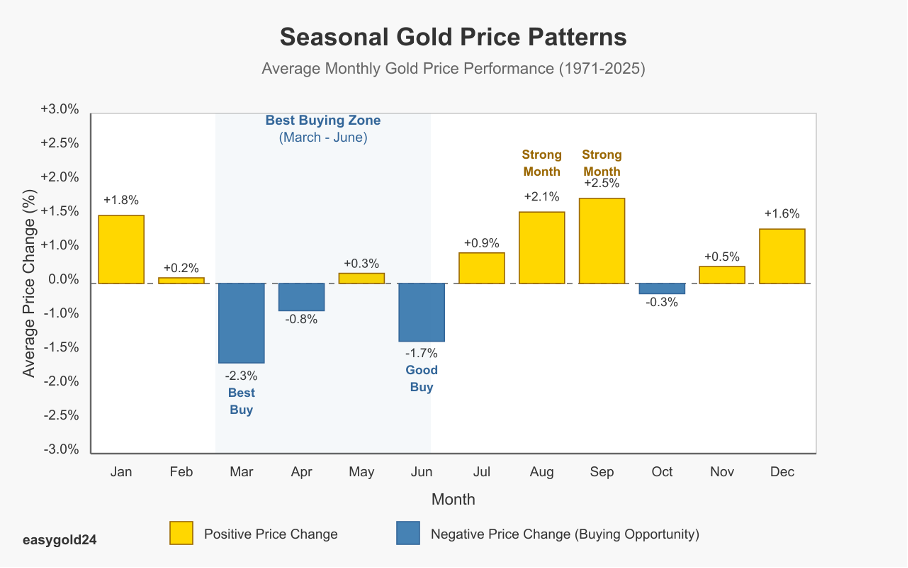
Historical gold price data reveals seasonal patterns that can benefit strategic investors:
- March typically offers the most cost-effective buying opportunity, with prices averaging 2.3% below yearly means
- Early January and late June also present favorable entry points
- Gold tends to perform strongest in January, August, and September
Dollar-cost averaging represents an effective strategy for building gold positions while managing price volatility. By making regular purchases regardless of current prices, investors can accumulate positions at favorable average costs.
Is Gold a Good Investment During Inflation?
Gold has consistently demonstrated its value as an inflation hedge throughout history:
- During the high inflation of the 1970s, gold prices increased over 1,500%
- In the 2007-2011 period of quantitative easing, gold gained approximately 170%
- During the 2020-2025 inflationary period, gold has appreciated over 60%
For investors concerned about currency devaluation and purchasing power preservation, gold’s historical track record provides compelling evidence of its protective properties during inflationary environments.
Enduring Value in an Uncertain World

Gold’s remarkable journey through five decades demonstrates its enduring value as a wealth preserver and investment powerhouse. The data speaks for itself—from the 1970s oil crisis to the recent COVID-19 pandemic, gold has consistently withstood economic storms while delivering substantial returns.
The precious metal’s rise to $2,946 per ounce in February 2025 confirms its continued relevance in today’s complex digital landscape. This performance reinforces gold’s essential role in any robust investment strategy.
EasyGold24: Your Gateway to Gold Investment
As a leader in gold investment solutions, EasyGold24 (Hartmann & Benz) has recently achieved a significant milestone by successfully listing on the OTCQB market. This achievement provides our investors with enhanced liquidity and market access.
Our innovative EasyGold security token represents direct gold ownership, enabling investors to hold substantial quantities of gold without the logistical challenges of physical storage. This digital solution streamlines trading and reduces costs compared to traditional methods.
Building Resilient Wealth
Based on fifty years of data, gold remains vital for building resilient investment portfolios that offer both growth potential and protection against economic uncertainty. As global markets continue to evolve, incorporating gold into your investment strategy has never been more important.
Start Your Gold Investment Journey Today
Ready to strengthen your portfolio with gold? Explore our investment options and security token offerings today. Our team of experts is available to help you develop a gold investment strategy tailored to your financial goals.