Raw Materials: An Introduction
How to Trade Commodities
Commodity trading offers substantial opportunities for investors looking to diversify their portfolios and capitalize on market volatility. In 2023, the commodity market generated over $100 billion in EBIT, highlighting the growing interest in this sector. Commodities fall into four key categories: agricultural products, energy resources, metals, and livestock—all of which are critical to the global economy.
The high price volatility of commodities, compared to stocks and bonds, creates unique opportunities for traders to profit. Futures contracts are commonly used to trade commodities, allowing traders to manage risks while speculating on future price movements. These contracts help investors hedge against market uncertainties, making commodities a valuable addition to portfolios, especially during times of economic instability.
Whether you’re focusing on crude oil trading or agricultural products with increasing global demand, understanding how to analyze the markets and identify emerging trends is key to developing a successful strategy.
Understanding Core Commodity Market Dynamics
Price discovery is the lifeblood of commodity markets. Buyers and sellers establish fair values through a complex interplay of factors, including tangible elements like supply-demand patterns and intangible aspects such as investor risk sentiment and the overall economic climate.
Supply and Demand Fundamentals
Supply and demand patterns form the foundation of commodity price movements. Commodities come with limited supply in any given period. Even renewable resources like grains only become available in specific quantities during harvest seasons. When market disruptions occur, producers cannot react quickly, making price changes the primary mechanism for handling short-term supply and demand shocks.
Weather plays a crucial role in agricultural commodity supplies, affecting everything from planting to growing and harvesting cycles. Adverse weather conditions can reduce harvest yields, leading to supply fluctuations. Metals and energy commodities face different challenges, with infrastructure and operational factors having greater impact than weather conditions.

Price Discovery Process
The price discovery process in commodity markets has evolved significantly. Futures markets now lead this process for agricultural commodities, serving as ideal venues for gathering and sharing information.
Speculation enhances price discovery efficiency. Studies indicate that when speculators participate, they reduce noise in futures markets, making price discovery more effective. The market functions more efficiently as trading volume increases.
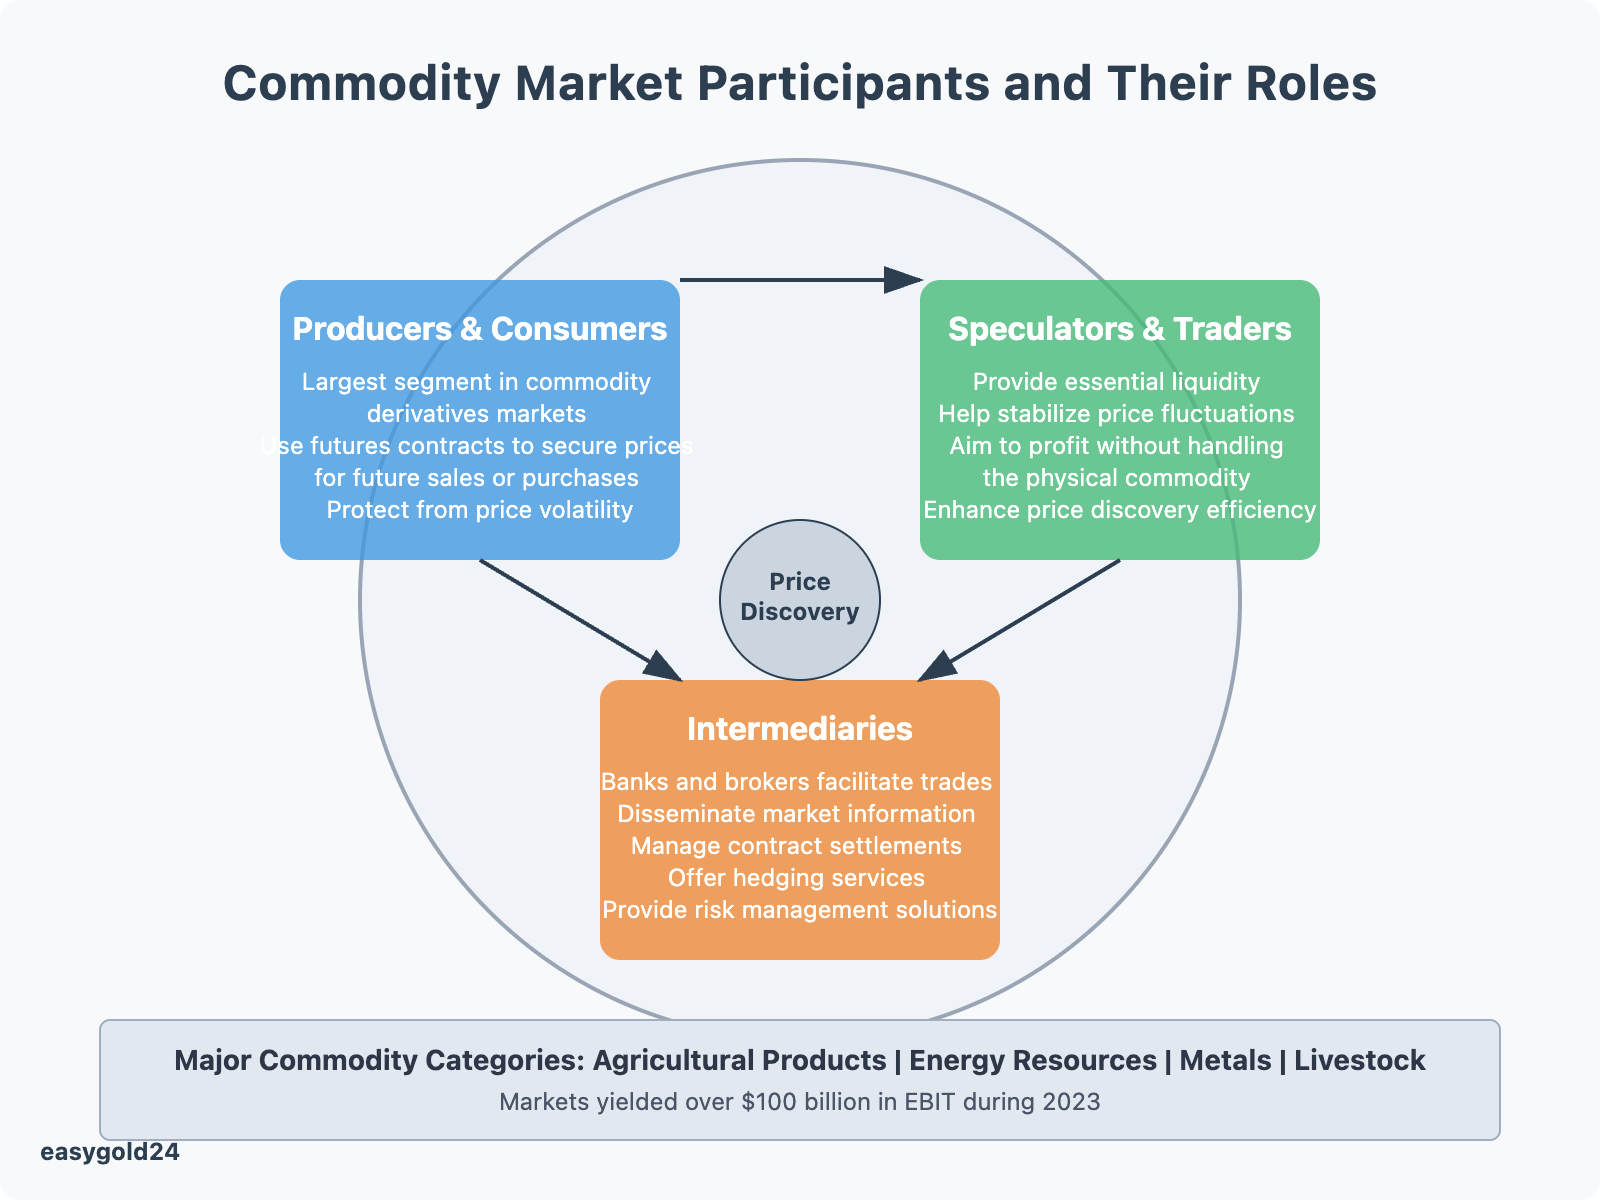
Market Participants and Their Roles
The commodity market features several key players, each with distinct roles:
Producers and Consumers: This group constitutes the largest segment in commodity derivatives markets. Producers use futures contracts to secure prices for future sales, protecting themselves from price volatility. Consumers similarly lock in prices for raw materials they will require.
Speculators and Traders: These participants provide essential liquidity and help stabilize price fluctuations. Unlike hedgers, they aim to profit without handling the physical commodity.
Intermediaries: Banks and brokers facilitate trades, disseminate market information, and manage contract settlements. They also offer hedging and risk management services to clients.
Commodity market participants face numerous risks: market risks from global financial turbulence, credit risks from failed transactions, business risks from sudden demand contractions, and operational risks from infrastructure failures. Price movements in commodity markets typically run counter to stocks, making them excellent for diversifying investment risk.
Commodity markets have become increasingly interconnected. The average correlation between commodities linked to energy transition doubled to 56% in 2022-23 from 27% in 2015-19. This heightened correlation, combined with more diverse supply sources, results in fewer long-term relationships and greater exposure to short-term contracts.
Market news and information flow shape price discovery. Prices can shift instantaneously when new information or rumors emerge. Participants with access to the best, most current information gain an advantage in decision-making. Digital platforms have democratized price information through internet accessibility.
Essential Tools for Commodity Market Analysis
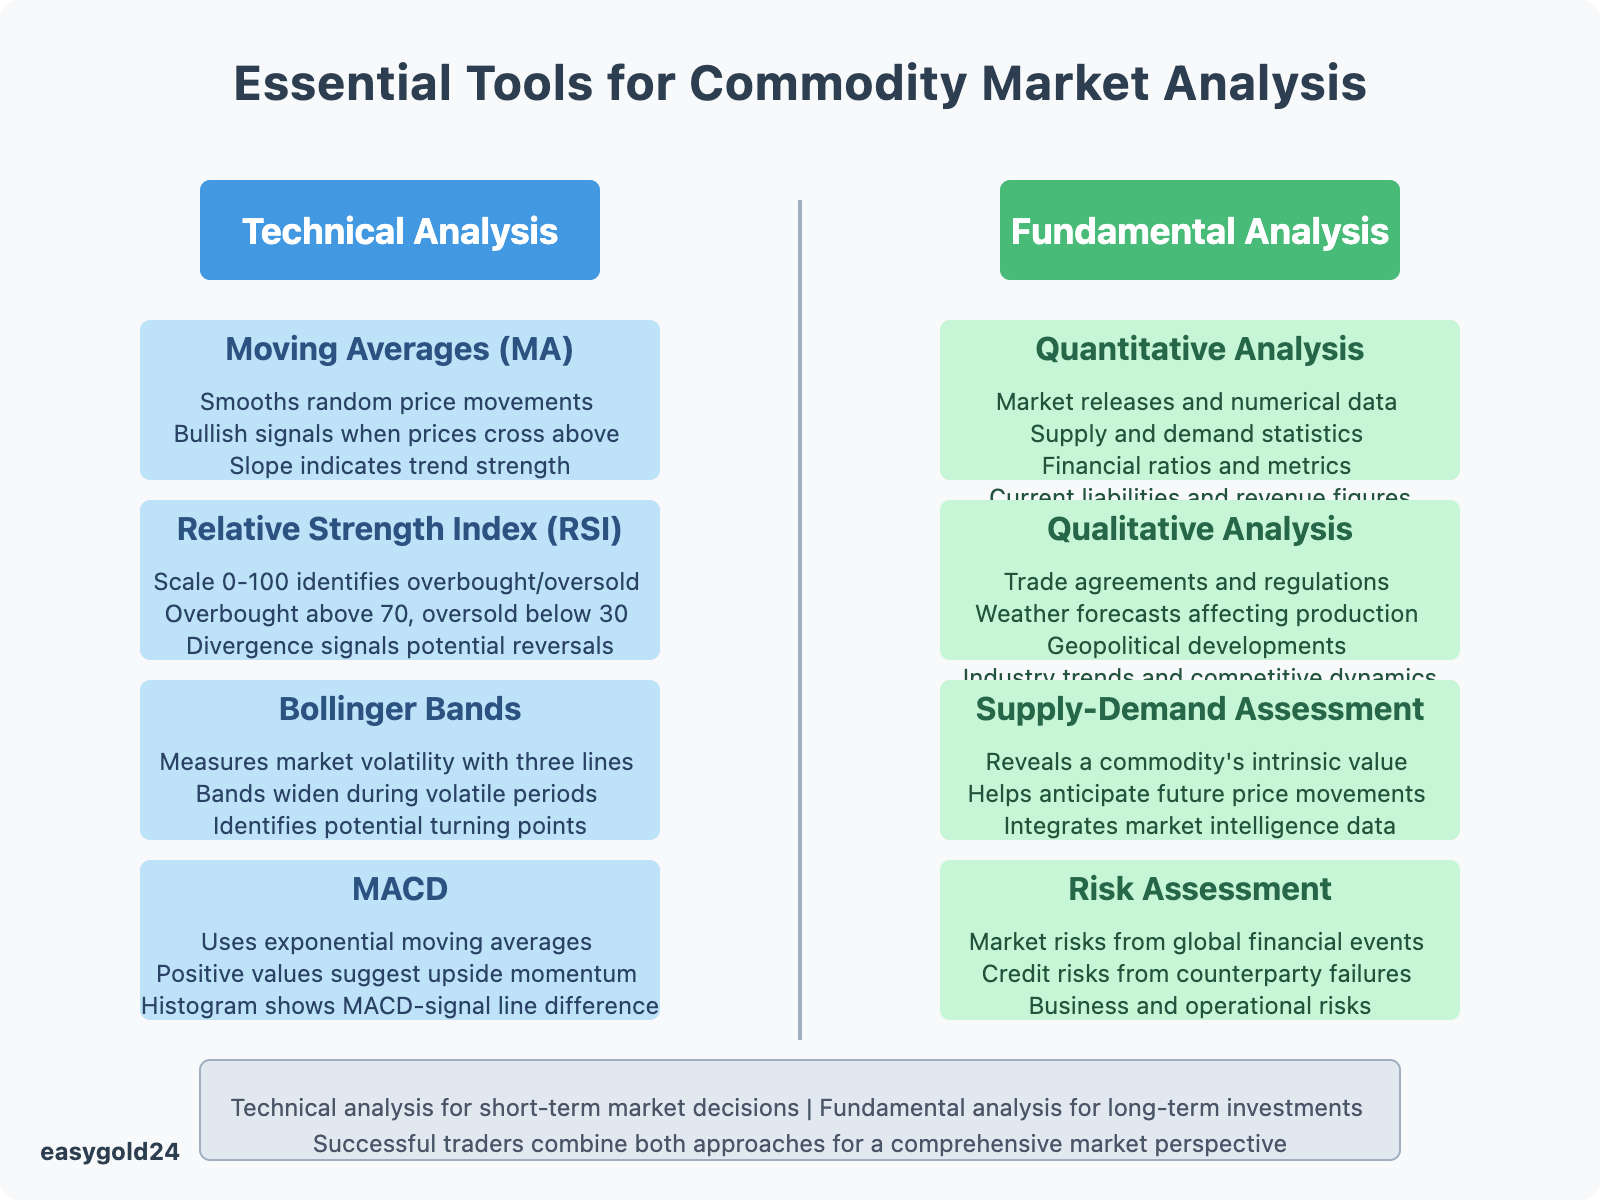
Traders must master both technical and fundamental analysis tools to identify profitable opportunities in ever-changing commodity markets. These analytical frameworks help interpret market signals and lead to more informed trading decisions.
Technical Analysis Indicators
Mathematical calculations based on historical price and volume data help traders predict future price movements. Several key indicators form the foundation for effective technical analysis:
Moving Averages (MA): This popular indicator smooths random price movements to reveal underlying trends. Bullish signals appear when prices cross above the MA from below, while crossing below indicates bearish sentiment. The MA’s slope indicates trend direction—steeper slopes suggest stronger momentum.
Relative Strength Index (RSI): Operating on a scale of 0 to 100, RSI identifies overbought and oversold market conditions. Markets become overbought above 70 and oversold below 30. RSI divergence occurs when an asset reaches new highs but the indicator fails to exceed previous peaks, signaling potential reversals.

Bollinger Bands: Developed by John Bollinger in the 1980s, this indicator measures market volatility using three lines—a centerline (trend), upper line (resistance), and lower line (support). The bands widen during volatile periods and narrow when prices trade within a range. Traders look for potential turning points in range-bound markets using these bands.
Moving Average Convergence Divergence (MACD): This trend-following momentum indicator uses exponential moving averages to generate trading signals. Positive MACD values suggest increasing upside momentum, while declining values indicate momentum loss. The MACD histogram displays the difference between MACD and signal lines.
Fundamental Analysis Framework
Examining core factors that drive commodity supply and demand helps determine intrinsic value. This approach encompasses both quantitative and qualitative variables:
Quantitative Analysis:
- Market releases and reports with numerical data
- Supply and demand statistics
- Financial ratios and metrics
- Current liabilities and revenue figures
Qualitative Analysis:
- Trade agreements and regulations
- Weather forecasts affecting production
- Geopolitical developments
- Industry trends and competitive dynamics
The fundamental analysis process focuses on:
Supply-Demand Assessment: Understanding changes in supply and demand levels reveals a commodity’s intrinsic value. Traders use this information to anticipate future price movements.
Market Intelligence Integration: Effective fundamental analysis requires detailed market data from platforms like Bloomberg Terminal and Thomson Reuters Eikon. These platforms provide real-time insights into price movements, news developments, market fundamentals, and regulatory changes.
Geographic Information Analysis: GIS tools analyze spatial data and map commodity supply chains. Traders can identify geographic patterns, locate key production areas, detect supply chain vulnerabilities, and optimize logistics routes.
Risk Assessment: Fundamental analysts evaluate various risk factors, including market risks from global financial events, credit risks from counterparty failures, business risks from demand shifts, and operational risks from infrastructure issues.
Fundamental analysis works best for long-term investments by examining demand-supply dynamics and economic policies. Technical analysis is better suited for short-term market decisions through analysis of price patterns and volume trends. Many successful traders combine both approaches to develop a comprehensive market perspective.
Identifying High-Probability Trading Opportunities
Traders who understand key market signals can identify profitable opportunities in commodity markets. A detailed examination of supply chain disruptions, seasonal patterns, and geopolitical events reveals high-probability trading setups.
Supply Chain Disruption Signals
Supply chain disruptions have become primary drivers of commodity price movements. Supply shocks emerged as the main catalysts for inflation in global markets after the mid-2010s. The COVID-19 pandemic exacerbated these effects, as crude oil tanker rates surged to $150,000-200,000 per day in early 2020.
Global commodity flows face several challenges:
Regional Events: The Panama Canal drought and Red Sea attacks restrict cargo movement.
Trade Flow Changes: Russian energy exports shifted from Europe to China and India, creating longer shipping routes.
Agricultural Disruptions: Black Sea export constraints affected 25-30% of global wheat trade, 20% of corn trade, and over 50% of sunflower oil supplies.
These disruptions create opportunities through flow rerouting and freight optimization, storage asset utilization, and commodity blending to meet specifications.
Seasonal Price Patterns
Seasonal patterns play a vital role in commodity trading, especially in agricultural markets with regular supply-demand cycles. In grain commodities:
Corn Markets: Prices peak around July due to new crop uncertainty and decline during harvest season. Corn prices reach their lowest point during fall harvest nine years out of ten.
Soybean Markets: Prices fall from July-August through February. South American harvest begins in February and influences U.S. market dynamics. Price peaks typically occur in mid to late summer.
Wheat Markets: Prices usually decline between spring and July harvest, then rise through fall and winter. This pattern aligns with standard trading months that correspond with planting, harvesting, and marketing cycles.

Geopolitical Impact Assessment
Geopolitical risks influence commodity price movements through direct and indirect channels. Recent studies highlight several key impacts:
Energy Markets: The United States, Germany, India, and Russia generate the most spillover effects. Energy markets respond strongly to geopolitical shocks from Germany, Russia, France, and Italy.
Trade Flow Disruptions: The Red Sea handles approximately 12% of global maritime trade. Regional conflicts affect freight insurance rates, trade journey durations, supply chain efficiency, and inflationary pressures.
Market Correlations: Commodity markets have grown more interconnected. The correlation between energy transition commodities doubled to 56% in 2022-23 from 27% in 2015-19.
Supply chain disruptions, seasonal patterns, and geopolitical events often amplify each other’s effects. For instance, the Russia-Ukraine conflict disrupted Black Sea exports and affected global agricultural commodity flows beyond normal seasonal variations.
Successful traders develop specialized market knowledge and create information advantages. This expertise helps them anticipate and respond to price spikes from geopolitical tensions or identify undervalued commodities during trade embargoes.
Building Your First Commodity Trading Strategy
A well-designed trading strategy serves as the foundation of successful commodity trading. Traders maximize potential returns in volatile markets through careful consideration of position sizing, entry-exit rules, and risk parameters.
Position Sizing Guidelines
The size of your trading position directly affects outcomes. Determine appropriate trade sizes before entering the market. Most retail traders maintain risk between 1-2% of their investment capital per trade. For example, a $25,000 account with 2% maximum risk should not exceed $500 per trade.
The optimal position size calculation involves:
- Determining account risk (percentage of capital)
- Identifying trade risk (distance between entry and stop-loss)
- Dividing account risk by trade risk
Here’s a practical example: You plan to buy at $160 with a stop-loss at $140. The trade risk equals $20 per share. With $500 account risk, you should trade 25 shares ($500/$20).
Entry and Exit Rules
Both technical indicators and fundamental factors help create effective entry and exit rules. You need clear criteria for:
Entry Points:
- Price action signals
- Technical indicator confirmations
- Volume analysis
- Market depth interpretation
Exit Conditions:
- Percentage gain objectives
- Dollar-based profit targets
- Technical resistance levels
- Changes in fundamental outlook
Traders employ limit orders and stop orders to automate their exits, especially when they cannot monitor markets continuously. Good ’til canceled (GTC) orders remain active until executed or manually canceled.
Range trading strategies work well in commodity markets. You can buy near support levels and sell at resistance. The Commodity Channel Index (CCI) helps confirm overbought and oversold conditions.
Risk Management Parameters
Risk management provides multiple layers of protection against adverse market movements. Place stop-loss orders at logical price levels where market movements indicate an incorrect trade premise. Stops should reflect normal market volatility rather than arbitrary placement.
To control risk effectively:
Portfolio Heat Management:
- Monitor position correlation
- Track total risk exposure
- Review market volatility effects
Credit Risk Control:
- Review counterparty creditworthiness
- Use credit insurance when needed
- Set collateral requirements
Stress testing and scenario analysis prepare traders for extreme market conditions. Regular portfolio reviews allow necessary adjustments to protect capital. Successful traders maintain detailed trade records and learn from their performance to improve strategies.
Strong internal controls and standardized procedures reduce operational risk. Traders must also stay informed about regulatory changes in their chosen markets. Remember that losses will occur—the key is to keep them small enough to continue trading until profitable opportunities emerge.
Choosing the Right Trading Instruments
The selection of trading instruments plays a crucial role in commodity markets. Traders can optimize market exposure and risk management strategies by carefully evaluating different vehicles.
Futures Contracts vs ETFs
Futures contracts offer significant advantages over Exchange-Traded Funds (ETFs) in commodity trading. Futures lack the management fees associated with ETF investments. Markets remain open nearly 24 hours, allowing traders to respond immediately to overnight events.
Trading volumes highlight the difference between futures and ETFs. Treasury, crude oil, and gold futures trade 20-600 times more in dollar value than their ETF counterparts each day. S&P 500 futures perform even better—they trade 11 times more than the world’s leading S&P 500 ETFs.
ETFs face several challenges:
- Fund rebalancing requirements compromise performance tracking
- Administrative costs diminish returns
- Management fees reduce long-term profits
Nevertheless, ETFs serve specific needs effectively. They provide investors with convenient market access and position management without navigating futures market complexities.
Popular commodity ETFs include:
- SPDR Gold Shares (GLD) – tracks gold prices
- United States Oil Fund (USO) – follows crude oil
- iShares Silver Trust (SLV) – mirrors silver performance
- PowerShares DB Agriculture Fund (DBA) – tracks agricultural commodities
Futures contracts excel for active traders. Their standardized format enables efficient buying and selling of specific commodity quantities at predetermined prices. The secondary marketplace allows traders to avoid physical delivery.
Options Strategies for Commodities
Options contracts provide commodity traders with additional tools for risk management and speculation. These derivatives permit traders to buy or sell commodities at specific prices within designated timeframes.
Short-term options have gained popularity. Traders use them to plan around specific market events, alleviating event risks, speculating on price directions, and targeting specific market occurrences.
Market-moving events that influence options trading include:
Energy Markets:
- EIA weekly inventory reports
- OPEC Monthly Oil Market updates
- Production data releases
Agricultural Markets:
- USDA reports
- Weather forecasts
- Supply-demand updates
Vertical spreads dominate agricultural options trading, constituting over 80% of total spread volume from 2017 through 2019. Corn market call verticals align with North American growing seasons, when call skew reaches its peak.
Risk reversals are prominent in wheat markets, comprising twice the share of total option spread volume compared to other agricultural commodities. This strategy involves buying out-of-the-money calls while selling out-of-the-money puts, or the reverse.
Trading commodity options requires understanding these fundamentals:
- Strike prices determine execution levels
- Expiration dates establish time boundaries
- Premium costs reflect market expectations
Your trading objectives, risk tolerance, and market knowledge determine which instruments work best. Futures excel in efficiency and direct market access. ETFs offer simplicity. Options provide flexibility, enabling you to target specific risks and opportunities across commodity markets.
Real-Time Market Analysis Techniques
Live analysis enables commodity traders to make rapid decisions as markets evolve. By examining price movements, volume patterns, and order flow data carefully, traders gain valuable insights into market sentiment and price directions.
Price Action Trading
Price action analysis examines price movements without external indicators. This approach is based on the premise that price reflects all available market information and trader sentiment. Traders look for specific patterns that indicate potential market reversals or continuations.
Traders seek entry points during pullbacks in trending markets. Range-bound conditions provide opportunities to buy at support and sell at resistance levels. Evidence suggests that price action is particularly effective in commodity markets because these assets respond strongly to global economic factors and speculative forces.
For optimal results, traders monitor:
- Support and resistance zones
- Market structure formations
- Candlestick patterns
- Price rejections at key levels
Volume Analysis
Volume is a critical tool that confirms price movements in commodity markets. Higher volume validates the current price direction, while diminishing volume may indicate trend reversals. Volume analysis helps traders track the collective “votes” for market direction, as each trade represents someone’s opinion about future prices.
The standard volume study appears as a histogram beneath price charts and represents contracts traded in specific time periods. Simple averages applied to volume indicators help traders quickly identify above or below-average trading activity.
Volume Profile offers another powerful visualization method by displaying contract quantities at different price levels. This helps traders identify:
- Points of control (most traded prices)
- Value areas (68% of trading activity)
- Key support/resistance zones

Market Depth Interpretation
Market depth data indicates how effectively the market can absorb large orders without significant price impact. This information helps traders understand liquidity conditions and potential price movements. Market depth examines both order size and price levels to reveal trading opportunities.
Live market depth data enables traders to:
- Monitor bid-ask spreads
- Track large order flows
- Identify potential breakout points
Robust market depth generally indicates strong liquidity, allowing efficient execution of large orders. Poor depth may suggest price volatility when substantial orders enter the market.
The depth of market (DOM) displays data in static mode, maintaining fixed price series while actual prices move between established ranges. This helps traders monitor order position management, total position sizes, and price level concentrations.
Utilizing live market depth provides traders with advantages through order flow analysis, supply-demand visualization, and liquidity assessment.
Modern trading platforms integrate these analytical components to deliver comprehensive market insights, including integrated intelligence across supply chains, live price movements, regulatory updates, and market fundamentals.
Combining price action, volume analysis, and market depth interpretation provides traders with a complete understanding of current market conditions. This comprehensive approach facilitates rapid identification of trading opportunities while maintaining awareness of risks.
Risk Management Framework for Commodity Trading
Risk management is essential for profitable commodity trading. Traders need a systematic approach to protect capital while maximizing returns. They safeguard investments against market volatility by implementing stop-loss strategies, analyzing correlations, and monitoring portfolio heat.
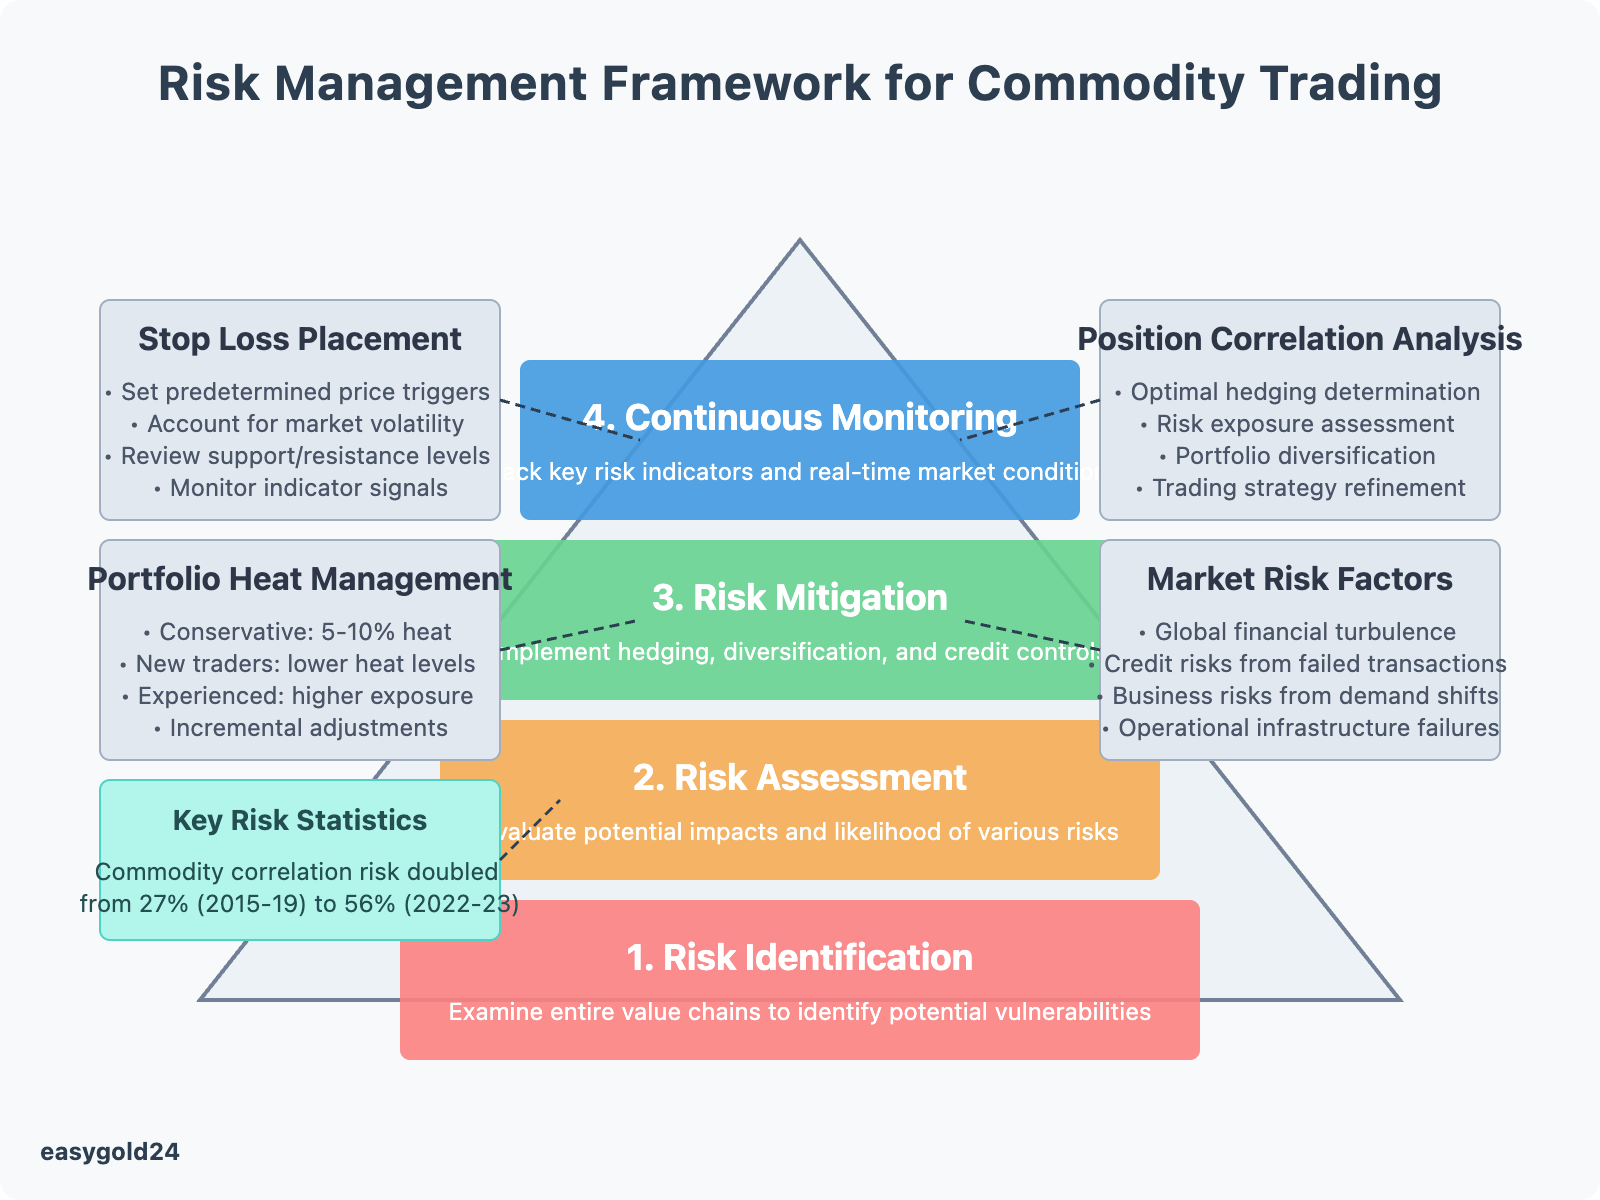
Stop Loss Placement
Stop-loss orders are critical risk management tools that function as insurance against significant losses in commodity trading. New traders must limit risk exposure. Even experienced traders need predetermined exit points to avoid catastrophic losses.
Optimal stop-loss placement depends on several key factors:
- Setting predetermined price triggers
- Accounting for market volatility
- Reviewing support/resistance levels
- Monitoring indicator signals
Time-based stops offer another efficient risk management method. Traders exit positions to preserve capital if prices don’t move favorably within a specific timeframe. This approach is most effective when market conditions fail to validate the original trade premise.
Position Correlation Analysis
Understanding position correlations helps manage combined portfolio risk. Research indicates commodity correlation risk has doubled from 27% in 2015-19 to 56% in 2022-23. This increased interconnectedness requires careful attention to position relationships.
Correlation analysis benefits traders through:
- Optimal hedging determination
- Risk exposure assessment
- Portfolio diversification
- Trading strategy refinement
Physical commodities and their related futures prices exhibit varying correlations over time. Traders must update correlation assessments regularly to maintain effective risk management. Rolling window correlation estimates provide more accurate information about asset price movements.
Portfolio Heat Management
Portfolio heat represents total position risk exposure across open trades. A trader with 1% portfolio risk per trade and five open positions creates 5% portfolio heat. Prudent traders monitor this metric closely to avoid excessive exposure during volatile markets.
Key aspects of portfolio heat management include:
Risk Allocation:
- Conservative traders maintain 5-10% portfolio heat
- New traders benefit from lower heat levels
- Experienced traders may tolerate higher exposure
Position Adjustment:
- Increase heat levels incrementally
- Monitor position reactions
- Adjust stops based on market behavior
An integrated risk management framework comprises multiple components:
- Risk Identification: Examine entire value chains to identify potential vulnerabilities
- Risk Assessment: Evaluate potential impacts and likelihood of various risks
- Risk Mitigation: Implement strategies like hedging, diversification, and credit controls
- Continuous Monitoring: Track key risk indicators and real-time market conditions
Contemporary commodity trading platforms integrate these risk management components, providing traders with detailed market information across supply chains. Effective risk management requires regular portfolio monitoring and strategy adjustments based on changing market conditions.
Developing Your Trading Edge
Success in commodity trading stems from focused market specialization and robust information gathering systems. Traders position themselves for long-term success by mastering specific market segments and developing superior data analysis capabilities.
Market Specialization Strategy
Profitable commodity traders typically focus on either a single market or a small market segment. Successful traders concentrate on specific areas like precious metals or grain futures, developing deeper market understanding through concentrated analysis.
Traders can identify markets aligned with their strengths through a six-month trading review. They build greater confidence in specific commodities that complement their analytical skills. Those who excel in oil futures trading often succeed when expanding into related markets like natural gas or heating oil.
Major institutional traders exemplify this specialized approach. Trading desks at banks rarely assign one trader to manage both gold and soybean markets. They organize commodity trading operations around dedicated teams focusing on specific segments such as:
- Energy futures
- Precious metals
- Agricultural commodities
This market focus enables traders to develop deep market expertise, recognize recurring patterns, build reliable trading systems, and create sustainable competitive advantages.
Information Advantage Creation
Modern commodity intelligence integrates multiple data streams to generate actionable information. Sophisticated traders utilize advanced technologies and data sources including:
- Market reports and trade publications
- Government releases
- Proprietary data feeds
- Satellite imagery analysis
Satellite data enhances trading decisions by providing unique insights across commodity markets. Advanced algorithms correlate satellite information with other big data sources to create powerful analytical tools that reduce trading risks, generate higher returns, enable immediate monitoring, and track supply chain efficiency.
Predictive analytics plays a crucial role by using statistical models and machine learning to forecast future commodity prices. Visualization tools present complex data through charts, graphs, and heat maps that highlight patterns concealed in raw data.
Future market leaders will make data-driven decisions while efficiently managing growing information volumes. High-quality data access and the ability to generate useful insights are essential for all managers of energy exposure throughout the value chain.
The competitive advantage from new analytics becomes increasingly time-sensitive. New models require constant updates immediately after creation. Leaders must build data architecture that allows analysts and data scientists to iterate quickly in-house.
A modular design in data architecture and analytics provides necessary flexibility and speed. Converting raw data into meaningful insights helps traders handle the data tsunami, create new analytics faster, respond to innovators, and integrate third-party offerings.
Seasonal patterns offer another avenue to information advantages. Nearly all major commodity markets follow established seasonal price patterns that traders can track and leverage. While seasonal trading provides no guarantees, it gives traders an additional edge to confirm existing trends or identify potential changes.
Trading Commodities: Key Insights and Strategies
Commodity trading presents unique opportunities for those seeking to diversify their investment portfolios. To succeed in this dynamic market, traders must understand the key drivers behind commodity prices, including supply-demand factors, geopolitical events, and global economic trends. Whether trading agricultural products, metals, energy resources, or livestock, it’s essential to stay informed and develop a comprehensive strategy.
Successful traders focus on specific commodity segments and use technical analysis tools, such as RSI and Bollinger Bands, to identify market trends. These traders also integrate fundamental analysis to understand price movements, making informed decisions based on supply and demand shifts and broader economic conditions. Risk management remains a crucial element in commodity trading, with prudent position sizing, stop-loss strategies, and correlation analysis helping to navigate periods of volatility.
As technological advancements and shifts in global trade patterns continue to reshape the commodity landscape, staying adaptive and disciplined is vital for sustained success. Investors who master the intricacies of the market, leverage superior data analysis, and maintain a strong risk management framework position themselves to thrive in this evolving environment.
Hartmann & Benz is currently advancing its plans to go public with shares now listed on the OTCQB market. As we continue to expand, we’re introducing the EasyGold security token alongside our market listing, offering a streamlined, cost-effective way to hold and trade gold without physical storage. Our focus remains on providing innovative solutions for investors, making gold trading more accessible and efficient. Stay updated on our progress as we work towards further market developments and growth opportunities.